
Case Studies
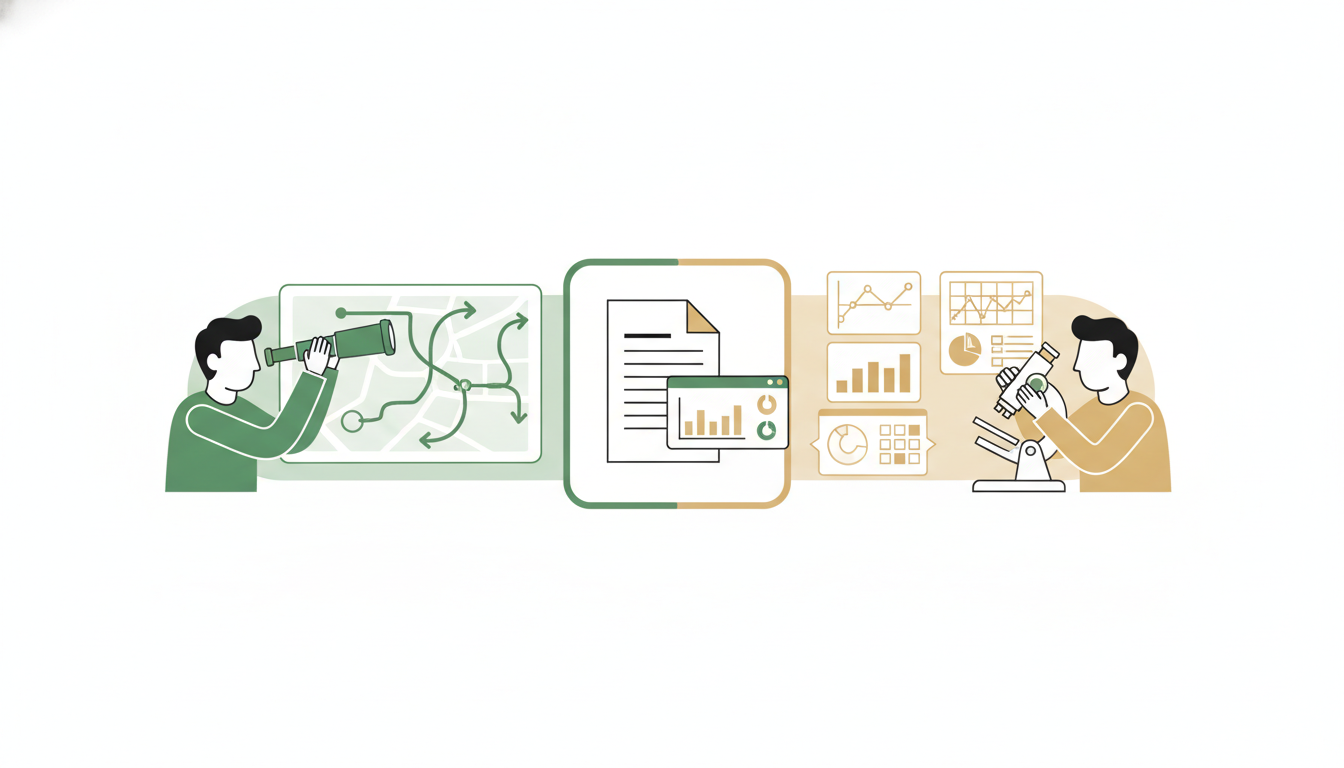
These walkthroughs show how Alfred and Ada approach the same high-stakes scenario from different angles. Alfred operates as the strategist — framing the problem, mapping second-order effects, and structuring the narrative. Ada operates as the analyst — working from raw data, surfacing patterns, and building evidence-backed outputs.
This two-personas premise is exactly what Swarm mode does for real: switch to chat input → model selector → Mode row → Swarm, and Alfrada OS runs both angles at once as parallel agents instead of one after the other. Swarm is available on every plan, and the orchestrator assigns models per agent — so your own model pick doesn't apply while it runs.
Each case study includes a step-by-step flow diagram showing the expected tool chain, decision points, and deliverables.
APAC Market Entry
A company is evaluating expansion into the Asia-Pacific region. Both personas work on the same scenario but solve different parts of it.
Alfred: Map Second-Order Effects
Alfred's job is to think beyond the obvious. He researches the market, identifies direct implications, and then maps the ripple effects that most analyses miss.
Map the second-order effects of entering the APAC market for [company/sector]. Start with the direct implications — regulatory, competitive, distribution — then map what each of those triggers downstream. I want supply chain effects, talent market shifts, likely competitor responses, and capital flow implications. End with a decision matrix that scores each path by upside, risk, and reversibility.Alfred is wired to connect signals across domains and surface the effects that only show up one or two moves later.
Ada: Analyse Entry Risks and Upside
Ada works from the dataset. She runs the numbers, flags anomalies, scores risks against upside, and produces a visual output the team can act on immediately.
Use the attached dataset to analyse APAC market entry risks and upside. Run a data quality check first, then profile the key variables. Build a risk-adjusted scoring model, run sensitivity on the top 3 assumptions, and output: 1) an Excel dashboard with charts, 2) a one-page summary with confidence bands for each market.Ada turns raw numbers into decision-ready analysis with explicit confidence levels so the team knows where the data is strong and where it's thin.
Q3 Board Narrative
The board meeting is in two weeks. The team needs a narrative that tells the truth about the quarter — wins, misses, and what comes next.
Alfred: Draft a Q3 Board Narrative with Evidence
Alfred structures the story. He pulls together fragmented inputs, decides what the board actually needs to hear, and builds a narrative arc that leads to decisions.
Draft a Q3 board narrative from the attached materials. Start with the quarter's thesis — what we set out to do and what actually happened. Classify wins and misses honestly, attribute causes, and connect each to forward-looking implications. End with the 3 decisions the board should focus on. Output as a memo and a 10-slide deck with an evidence appendix.Alfred builds narratives that survive scrutiny. He does not polish bad results — he frames them in context and connects them to what comes next.
Ada: Build a Q3 Pivot Board Narrative with Evidence
Ada builds the quantitative backbone. She takes the same raw inputs, structures the data story, and creates the pivot tables and charts that make the narrative undeniable.
Build a Q3 board narrative from the attached data. Clean and normalize the inputs, then run QoQ and YoY variance analysis across all segments. Create pivot tables, flag anomalies, and decompose trends. Output: 1) a KPI scorecard with RAG ratings, 2) an Excel workbook with pivot views, 3) a chart deck with waterfall, variance, and trend visuals ready for the board.Ada makes the numbers tell the story. Her output is the evidence layer that the narrative sits on — charts, pivots, and scorecards that answer the 'show me' question.
Take the Scorecard Live
A static RAG slide is out of date the day after the pack goes out. Ada's KPI scorecard can ship as an interactive HTML Dashboard instead — explorable in the browser, exportable to PDF for the board pack. The dashboards playbook covers layouts and auto-refresh.
Take the Q3 KPI scorecard and build it as an interactive dashboard I can explore in the browser — RAG status, variance drill-downs, and trend charts — and export to PDF for the board pack.The board gets a clean PDF page; you keep a live, filterable version for the follow-up questions the pack always triggers.
Enterprise AI Competitive Landscape
The strategy team needs a comprehensive map of the enterprise AI market — who is where, what's changing, and where the openings are.
Alfred: Build an Enterprise AI Competitive Landscape
Alfred builds the strategic map. He researches broadly, classifies players by positioning, and identifies the whitespace that matters for the company's next move.
Build a comprehensive competitive landscape for enterprise AI. Identify the key players, classify them by positioning (horizontal vs vertical, open vs closed, enterprise vs SMB), compare pricing and GTM approaches, and map product capabilities. End with: 1) a strategic group map, 2) whitespace analysis, 3) threat assessment, and 4) ranked opportunities. Output as a strategy memo and a presentation deck.Alfred does not produce a feature comparison spreadsheet. He maps the market in terms of strategic positioning, competitive dynamics, and actionable whitespace.
The first node in Alfred's flow — deep web research — is the step worth delegating. Smith, Alfrada's background research agent, can run that sweep as a deep dive that works through dozens of sources and returns cited findings, leaving the main conversation free to structure the map.
Before building the landscape, send Smith on a Neo-depth deep dive: for each major enterprise AI player, gather positioning, pricing, go-to-market moves, and recent funding — with a source for every claim. Then map the landscape from what he brings back.Neo is Smith's deepest research setting — a long, citation-backed pass — so the landscape is grounded in evidence rather than a single quick search.
Ada: Generate an Enterprise AI Competitive Map from Raw Research
Ada takes raw research inputs — articles, reports, product pages — and turns them into a structured, evidence-grounded competitive map with quantitative backing.
Use the attached research materials to generate a structured competitive map of enterprise AI. Extract companies, products, and metrics from each source. Cross-reference findings, build a feature scoring matrix, layer in funding signals and sentiment data, and produce: 1) a ranked competitive matrix in Excel, 2) a visual quadrant map, 3) a one-page executive summary with the strongest and weakest evidence flagged.Ada turns a pile of research tabs into a structured, scored, visual competitive map — with every claim traceable to a source and every ranking backed by explicit scoring criteria.
From Map to Outreach
A landscape is most useful when it ends in conversations. Hunter — Alfrada's built-in contact-discovery tool, no setup needed — can find and verify contact emails at the companies the map surfaces and drop them into a sheet for outreach.
From the competitive map, take the top 5 players by opportunity ranking. Find and verify partnership or business-development contacts at each, and put names, roles, and verified emails into a sheet for outreach.Hunter verifies each address before it lands in the sheet, so the outreach list starts clean instead of bouncing.
How These Work Together
The real power is running Alfred and Ada on the same problem. Alfred frames the question and structures the narrative. Ada provides the quantitative evidence and visual proof. The combination produces outputs that survive both the 'so what?' and the 'show me' tests.
And you don't have to run them one at a time. Switch to Swarm mode (chat input → model selector → Mode row → Swarm) and Alfrada OS gives each angle its own agent, runs them in parallel, and merges the results — this whole page is really a preview of what a Swarm turn does on its own.
In Swarm mode, run the APAC market entry case with one agent on second-order effects and one on the dataset, then merge both into a single decision memo.The Swarm's planner splits the work exactly along the Alfred/Ada line — strategist and analyst run in parallel, and you get one merged, decision-ready memo.
Under the hood — tools behind these additions
- Swarm mode — the Mode row in the model selector; the orchestrator assigns each worker its own model, so the session's model and Effort picks don't apply while a Swarm runs.
- Smith — tool id
agent_smith; effort levelsmorpheus(quick, ~13 tool calls),trinity(standard, ~33), andneo(deep dive, ~65). Trinity auto-escalates to Neo if it hits its work cap with real progress. - HTML Dashboard — tool id
html_dashboard; layouts and auto-refresh are covered in the dashboards playbook. - Hunter — Composio integration (
hunter_*tools such ashunter_email_finder,hunter_email_verifier,hunter_discover_companies); auto-connects with a shared server key and is discovery-only — results land in sheets, not a CRM.